Analysis of Epstein-Barr virus infected cell in human immunodeficiency virus infected patients
Zheng Heng, Department of Pathology, Tianli medical institute, Japan
Keywords: EBV, HIV, B cell, Macrophage, In situ hybridization
Correspondence to : Zheng Heng, M.D., Tianli medical institute,
1-2, Higashi 2-chome, Okegawa, Saitama, 363-0013, JAPAN.
E-mail: tianli88@gmail.com , TEL: 81-48-775-3408, FAX: 81-48-775-3409
Objective:
In order to clear the mechanism of carcinogenesis of Epstein-Barr Virus (EBV), twenty-eight specimens of human immunodeficiency virus (HIV)-positive non-neoplastic lymph nodes were used.
Methods:
We determined that the EBV-encoded small RNA-1 (EBER-1) is in the cell nucleus of the EBV infected cells by in situ hybridization (ISH) method. and determined the kind of cell in the cell membrane by immunohistochemical staining and measured cell by Image Analysis method.
Results:
The EBER-1 positive case are 9 cases in 28 cases (32%) studied. The majority of these 9 EBER-1 positive cases were B cells (5/9, 55%), macrophages (2/9,18%) and T cell (2/9, 18%). For the EBER-1 positive B cells, we determined that the latent membrane protein-1 (LMP-1) was an early index of tumorigenesis in 60% (3/5) of the tissues examined.
Conclusions:
It was observed that once infected in the immunocompromised state, the tumorigenesis rate became very high. Referring to the EBER-1 positive macrophage, we are hypothesizing that this did not appear by EBV infection, but rather by EBV englobement of the activated macrophage.
Introduction
EBV is classified as a subfamily of the gamma-herpes virus. It is a double-stranded filamentous DNA virus covered with a theca of glycolipid proteins 1. Reportedly, 60-80% of the human population is latently infected 2. EBV latently infected lymphocytes expressed EBER-1 in the cell nucleus.
EBER-1 is combined by RNA polymerase III and richly exists as a ribonucleoprotein
within the cell nucleus and is thereafter continuously expressed 3. In vitro, human B lymphocytes undergo blast formation when a certain factor is added and the infected cells are activated, which activates the cells to an immortalized state4 and unlimitedly reproduce. It is also well known that when the host falls
into the immunocompromised condition in vivo, the EBV infected cells are
easily activated. In activated cells, LMP-1 was expressed in the cell membrane,
and then tumorigenesis began. However, in the immunocompromised state like
HIV infected patients, transformed B lymphoblasts cannot be expelled by
the immune response. Therefore these patients are very susceptible to developing
the immunodeficiency syndrome-malignant lymphoma (AIDS-ML) 5.
In recent years, a large number of studies on the pathological alteration
of EBV-infected cells have been reported, however, a good deal is still
unknown. We based this study on the previous molecular biological and immunological
experiments 6, to determine the morphological alterations of EBV infected cells by the
image analysis method.
We used lymph nodes obtained from 28 HIV-positive individuals as models of immunodeficiency. We found that the EBER-1 gene was expressed in 9 cases by the ISH method. After the immunostaining of the lymph nodes from these 9 cases, 5 were B-cell marker positive, 2 were macrophage marker positive and 2 were T-cell marker positive. In the B cell marker positive cases, 3 cases were LMP-1 positive. Given the above-mentioned data, we determined that EBER-1 is an indicator of EBV infection, and LMP-1 is an early index of tumorigenesis. Furthermore, we presume that EBV does not only infect B cells but also macrophages or T cells. Therefore, we consider it valuable to examine whether macrophages englobe EBV.
Materials And Methods
Materials:
All 28 lymph node specimens used in this study were obtained from lymph node biopsies, which were for the determination of the cause of swelling from HIV-infected individuals. The specimens were supplied by Decones Hospital (Boston, MA, U.S.A.), Armed Forces Institute of Pathology (Washington, D.C., U.S.A.), Erie County Hospital (Buffalo, NY, U.S.A.). All specimens were formalin-fixed and paraffin-embedded. Lymph nodes from 20 HIV-negative patients were used as controls. These specimens were obtained from the Institute of Medical Science Hospital, University of Tokyo.
Methods:
First, we identified the EBER-1 by ISH. Secondly, we examined the immunological phenotype and viral protein of the EBER-1 positive cells by immuno-staining repeatedly on the EBER-1 expressed specimens. We then measured the area and circumference of the cells and nucleus by an image analysis method. Using an Olympus Avio SP500 video analyzer and its matching two-dimensional image analysis programs, we were able to analyze the image.
a. In Situ Hybridization Method :
Protocol of the ISH method is a modified method of DAKO JAPAN CO., LTD. Briefly, paraffin sections of 4μm thickness were deparaffined by xylene-ethanol and treated with 0.2 N HCl in order to remove non-specific reaction. The samples were then treated with 10% pronase for increase the permeability of the probe. They were blocked by Buffer 2 (Blocking reagent in DNA Detection kit) and treated with 0.25% acetic anhydride, as an acetylation reaction. Alkaline phosphatase labeled anti-digoxigenin antibody was used for a color development reaction and NBT/BCIP (Nitro Blue Tetrazelium/5-Bromo 4-chloro 3-indelyl-phosphate) was used as the chromogen. Throughout this procedure, 0.1% DEPC (diethyl-pyrocarbonate)-treated water was used. The EBER-1 probe was synthesized by a DNA synthesis apparatus (Cyclone Co., Ltd.). The arrangement was composed of 30 bases of oligonucleotides (5'-AGA CAC CGT CCT CAC CAC CCG GGA CTT GTA-3'), which was made by Chang 7. This probe was used at the concentration of 10-100 μg/mL. The labeling of EBER-1 probe was done according to the digoxigenin 3'-end labeling method 8.
b. Immunohistochemical Staining:
The avidin-biotin complex (ABC) method was used for immunohistological analysis. As primary antibodies, L26 (anti-B cell murine monoclonal antibody CD20), Leu4 (anti-T cell murine monoclonal antibody CD3), CS1-4 (anti-LMP-1 murine monoclonal antibody) and KP-1 (anti-macrophage murine monoclonal antibody CD68) [all Dako Japan Co., Ltd.] were used. Biotinylated anti-mouse immunoglobulins [Dako Japan Co., Ltd.] were used as a secondary antibody. LAB-peroxidase-conjugated striped-avidin [Dako Japan Co., Ltd.] was used for the third reaction. AEC-KIT [NICHIREI Corporation] was used for color development. The samples were enclosed with water-soluble mounting medium (Biomeda Corporation) and observed by optical microscope (LEITZ DM RXE).
c. Image Analysis Method:
Olympus Avio SP500 video analyzer was used for image analysis. Specimens were divided into 256 phases by the difference of light absorption. Staining conditions were confirmed by the sensitivity of each cell, and the area and circumference of the infected cell and its nucleus were measured. All these procedures were done utilizing two-dimensional image analysis programs (Olympus Co., Ltd.). Its operating procedures include binary processing, image contrast enhancement, binary image measurement, circle edge detection and measurement, compilation of a distribution graph, compilation of a correlation graph, and pseudo-color processing.
d. Morphological Classification of Lymph Nodes:
According to the histological classification of LAS (Lymphodenopathy Syndrome) by Dr. E. Grundmann of Germany 9, the lymph node specimens were classified into four stages.
Results
a.Morphological Examination:
The 28 HIV-bearing lymph node specimens after HE staining were classified into four stages according to the histological classification of LAS, as follows: (Table 1) (Fig. 1).
The IFH (Irregular Follicular Hyperplasia) stage; lymph node follicles became large and the crowded germinal centers are observed. In 15 total cases, EBV(+) was apparent in 1 case and EBV(-) was apparent in 14 cases.
The BFD (Beginning Follicular Destruction) stage; the decrement of the lymph node follicule, the hyperplasia of capillary and venula, and the increase of phlogocyte were observed. In 8 total cases, EBV(+) was apparent in 3 cases and EBV(-) was apparent in 5 cases.
The PFD (Progressive Follicular Destruction) stage; the obvious decrement of lymph node follicule, the obvious hyperplasia of capillary and venules, and the appearances of acidophil were observed. In 2 total cases, they all were EBV(+).
The FI (Follicular Involution) stage; the lymph node follicule’s germinal center disappeared and the withered follicule scattered. Many capillary and venule were found and macrophages were abundant. In 3 total cases, they all were EBV(+).
b. Virological Examination:
The EBER-1 was identified in 9 of 28 HIV positive lymph nodes (32%), and was identified in the cell nucleus. There were strong positive reactions (Fig. 2).
We checked the EBER-1 positive cell in lymph nodes. The number of positive cells per one visual field (at x400 magnification) was counted and the average of 10 fields was calculated. The results were expressed semiquantitatively as: +++ was 10 cells or over; ++ was less than 10 cells and over 5 cells; and + was less than 5 cells and over 1 cell in 1 field. There was 1 +++ case, 2 ++ cases, and 6 + cases (Table 1). All 20 cases were negative in HIV negative controls.
Most of the EBER-1 positive cells were observed in follicles and germinal centers of the lymph nodes and rarely existed in mantle zone and T nodule. With regard to cell size, a proportion of the EBER-1-positive B cells were small or medium-sized, while some were large or giant. When the specimens were observed with a two-dimensional microscope (x400 magnification), the largest cell had an area of 75μm2 and also 15μm2 cells were observed. The shape of the EBER-1 positive cells was circular, oval or asymmetrical in form.
The EBER-1 positive cell area was different in different location of lymph nodes. When the size is compared by mean cell area, it is 19.477μm2 in the marginal sinus, 14.246μm2 in the mantle zones, 14.028μm2 in the germinal center, and 11.950μm2 in the T nodule (Table 2).
This result indicates that HIV positive lymph nodes contain much more EBV positive cells in comparison to HIV negative lymph nodes.
c. Immunological Examination:
After reviewing the results by immunostaining and image analysis, phenotype of the EBER-1 positive cells were as follows;
Double immunostaining of EBER-1 and CD20 showed that EBER-1 was stained
black purple in nucleus and CD20 was stained red in the cell membrane (Fig.
3). 5 of 9 cases (56%) were CD20 positive (Table 3). There were 23 EBER-1
positive cells in 91 B cells of one germinal center.
LMP-1 was positive in 3 of 5 of the EBER-1 positive B cell cases. Average area was as follows: EBER-1(+) and LMP-1(+) were 62.83+6μm2, EBER-1(+), LMP-1(-) were 29.05+7μm2, and EBER-1(-) and LMP-1(-) were 9.20+2μm2 (Table 4). The cell expressing LMP-1 was obviously large. A color, high power image of x2500 magnification, showed that LMP-1 exists in the cell membrane in a dot formation (Fig. 4).
LMP-1 is + (+) at EBER-1 is + (++) in PFD stage and LMP-1 is ++ at EBER-1 is +++ in FI stage (Table 5). There is a direct proportion between LMP-1 and EBER-1 expression.
CD68 (macrophage marker) was positive in 2 of 9 cases (18%). There were 5 EBER-1 positive cells in 50 macrophage of one germinal center (Table 3). In a cell image with x2500 magnification, EBER-1 was expressed in the locations starting from cell membrane to the cytoplasm of a macrophage (Fig. 5).
The last 2 of the 9 cases (18%) were CD3 positive cases (to be discussed in the next paper).
Discussion
Remarkable advances in molecular biological and immunological methods in recent years have greatly simplified the detection of viral antigens, coherence proteins, and determination of viral genomes.
In this study, we identified EBER-1 as a right-turning RNA gene encoded in the Unique U1 region and expressed in the nucleus of lymphocytes 10.11 from lymph nodes of HIV positive patients by ISH. As a result, it was observed that EBER-1 existed in the cell nucleus. Furthermore, double treatment involving ISH and immunostaining was conducted to determine the phenotype of the EBV-infected cells, and the results indicated that they were B cells and macrophages.
1. EBV invasion of B cells
Most of the EBER-1-expressing lymph nodes belonged to the BFD, PFD or FI stage. On the other hand, most of the IFH were EBER-1-negative (Table 1). Therefore, it is suggested that EBV-positive cells tend to increase more easily in HIV-positive patients. The surface area of EBER-1-positive cells was about 15 - 75 μm2, which is obviously greater than that of normal cells (about 8 ? 12 μm2 ). This shows that the infected cells had already been transformed to blasts (Fig. 2) (Fig. 4).
EBER-1 is reported to become localized in cell nucleus by combining its 3' end with the antigenic determinant of the cell protein L, which is similar to U6 RNA, a low-molecular-weight RNA (snRNA) present in cell nucleus 5. Our findings were in accord with this, as EBER-1 was identified in the nucleus. We also observed EBER-1 on the cell nucleus membrane as a dot form by ISH-Electron microscope method (transmission). (This data is published in next report.)
In all 9 positive cases, the EBER-1-positive cells were identified in the marginal sinus and cortical sinus. Their number decreased in the order germinal center, mantle zone, and T-nodule in lymph nodes. EBV attaches to the receptor CD21 for the complement component CR2 on the B cell membrane and gets into the cell. EBV reaches the cell nucleus through endoplasmic reticulum and with unlimited reproduction, bringing about cellular DNA rearrangment, and causing the cell to lose their function. Table 2 shows that the size of the EBER-1-positive cells varied with their location in lymph nodes, perhaps due to differences in the degree of EBV infection or the phenotype of the infected cells (For example: macrophages, T cells or NK cells).
In order to determine the phenotype of the EBER-1-positive cells, we performed immunohistochemical staining after ISH, and found that 55% of the cells were B cells (Fig. 3). EBER-1 was identified in about 25% of B cells at the IFH and BFD stages (Table 3). EBV shows oncogenicity in humans, and has a biological characteristic of latent infection. When EBV invades B cells and some factors into the cell, the cells become blasts and are immortalized 12. This was confirmed by another experiment with TC -1 culture cell line (EBV (+) B cell lymphoma).
2. LMP-1 expression in THE EBER-1-positive cells
LMP-1 was most frequently detected at the FI stage, which is the most advanced stage (Table 1). The cells expressing both EBER-1 and LMP-1 were very large(62.83 μm2±), suggesting that they were activated (Fig. 4) (Table 4). This data shows that the LMP-1-positive B cells exist in lymph nodes at the advanced stage of HIV infection. These transformed cells may be precursors cells of tumor AIDS-ML.
LMP-1 has a left-turning gene, which is mapped to the 3' side of the Unique U5 region 10.11. It is known that LMP-1 is a 63-kDa membrane protein with a phosphorylated serine residue, present in a patch-like form on the membrane of infected cells through combination with the cytoskeletal protein vimentin 13.14. In this study, the LMP-1-positive cells formed blocks on the cell membrane, suggesting that LMP-1 participates in the transformation of EBV-infected B lymphocytes. LMP-1 is the most important among all the carcinogenesis-related proteins of EBV.
As can be seen in Table 5, the positivity rate of EBER-1 and LMP-1 increased simultaneously when the degree of HIV infection is increased. It was also pointed out that along with the increase of LMP-1, the patient’s condition has worsened in the FI stage.
On the other hand, some LMP-negative cells are found, suggesting that if a normal immune system is maintained, EBV latent infection persists. To prevent AIDS-ML, it is necessary to elucidate mechanism from EBV latent infection, to activation.
3. EBV englobement by macrophages
In recent years, activated macrophages have been found to play an important role in the biophylaxis of tumors 15. However, most of the existing information about the anti-tumor action of activated macrophages has been obtained through experimental studies on animals. There are few reports about the action of macrophages in EBV-positive lymph nodes of HIV patients.
In this study, we carried out immunostaining using anti-CD68 antibody (kp-1) in EBER-1- positive cases, and found that about 18% of the stained cells were macrophages (Fig. 5). EBER-1 was identified in about 10% of macrophages present in each visual field of germinal centers in PFD-stage lymph nodes (Table 3). For this reason, both EBV infection and EBV englobement were considerably high. Some reports have described the presence of EBV DNA in precursor monocyte-macrophage cell lines established from the bone marrow of children with hematopoietic maturation defects 16, and an expression of EBER-1 and LMP-1 in malignant histiocytes 17. However, most of these results did not exclude the possibility of histiocytic phagocytosis or emperipolesis of EBV carrying lymphocytes. But M. Shimakage excluded these possibilities using cultured macrophages. They also discovered lymphoma tissue showed EBV expression indicated that EBV had infected macrophages in vivo, and they suggest that EBV might propagate in macrophages because EBV replicative-infection genes were expressed in some macrophages 18. However, from the fact that macrophages have a phagocytosis 19, we presume that EBV was englobed by macrophages. The microscopy observations were also in accord with this, because: 1) within the same visual field, only a few macrophages bore EBER-1 while many did not, and 2) EBER-1 was evident in both the cell membrane and cytoplasm at x2500 magnification. If EBV had infected the macrophages, then: 1) EBV infection would have been confirmed in most of the macrophages, and 2) EBER-1 should have appeared in cell nucleus as a characteristic of EBV infected pattern. However, neither of these was observed. Macrophages exhibiting such phagocytosis may be activated macrophages.
In this study, besides typical macrophages, monocyte-like small macrophages were observed. These were in the process of transformation from monocytes in the blood to macrophages in tissue. Because these small macrophages were only rarely seen to englobe EBV, their activity and phagocytotic ability was considered to be very low.
Certainly, evidence of macrophage engulfing EBV was insufficient. We must conduct further research in the future.
References
- Takada K, Molecular mechanisms of establishment and disruption of Epstein-Barr Virus Latency. Protein Nucleic acid and enzyme 1989 ; 34: 7, 823-834,
- Aoyama Y, Minamiya M, Kurata T, EB virus. Clinic and Pathology of Virus Infected Disease 1991 ; 66-69,
- Janathan N, Clukman J, Gregory H, et al. Structural analysis of EBER1 and EBER2 ribonuclreoprotein particles present in Epstein-Barr virus infected cells. Journal of Virology 1988 ; 62: 902-911,
- Hirai K, Classification of EBV associated neoplastic cell by EB virus (EBV) gene expression. Pathology and Clinic 1993 ;11: 4, 493-503,
- Lawrence D Kaplan, Donald I Abrams, Ellen Feigal, et al. AIDS-associated non Hodgkin’s lymphoma in San Francisco. JAMA 1989 ; 261: 5, 719-724,
- Zheng H, Mori S, Epstein-Barr virus-infected lymphocytes in non-neoplastic lymph nodes of patients infected with human immunodeficiency virus. Pathology International 1997; 47: 217-221,
- Chang KL, Chen YY, Shibata D, et al. Description of an in situ hybridization methodology for detection of Epstein-Barr Virus RNA in paraffin-embedded tissues with a survey of normal and neoplastic tissue. Diagn-Mol-Pathol. 1992 ; 12: 1(4), 246-255,
- Nagasato H, Tokunaga M, Oyamada M, et al. Epstein Barr Virus (EBV) certification method in pathological specimen in situ hybridization in pathological examination room. Pathology and Clinic 1992 ; 10: 8, 951-955,
- Grundmann E. Immune reactions in the lymph node in cancer and AIDS. LEOPOLDINA 1991; (R.3) 36: 105-106,
- Sample J, Brooks L, Sample C, et al. Restricted Epstein-Barr virus protein expression in Burkitt lymphoma is due to a different Epstein-Barr nuclear antigen 1 transcriptional initiation site. Proc. Natl. Acad. Sci. 1991 ; 88: 6343-6347,
- Hennessy K, Fennewald S, Hummel M, et al. A membrane protein encoded by Epstein-Barr virus in latent growth-transforming infection. Proc. Natl. Acad. Sci. 1984 ; 81: 7207-7211,
- Miller G, Epstein-Barr virus: Biology, pathogenesis and medical aspects. In: Fields B.N., Knipe D.M. (eds.) Virology 2nded., Raven Press, New York, pp.1921-1957.
- Hitt MM, Allday MJ, Hara T, et al. EBV gene expression in an NPC-ralated tumor. The EMBO Journal 1989 ; 8: (9) 2639-2651,
- Liebowitz D, Kopan R, Fuchs E, et al. An Epstein-Barr virus transforming protein associates with vimentin in lymphocytes. Mol. Cell. Biol. 1987 ; 7: 2299-2308,
- Sone S, Fidler IJ, Tumor cytotoxicity of rat alveolar macrophages activated in vitro by endotoxin. J. Reticuloendothel Soc. 1980 ; 27: 269,
- Revoltella R P, Vigneti E, Fruscalzo A, et al. Epstein-Barr virus DNA sequences in precursor monocyte-macrophage cell lines established from the bone marrow of children with maturation defects of hematopoiesis. J. Gen. Virol. 1989 ; 70: 1203-1215,
- Ohshima K, Fujisaki T, Nagafuchi S, et al. Malignant histiocytosis derived from a common histiocytic clone in a patient with chronic Epstein-Barr virus infection. Leuk Lymphoma 1995 ; 17: 355-360,
- Shimakage, M, Kimura M, Yanoma S, et al. Expression of latent and replicative- infection genes of Epstein-Barr virus in macrophage. Archives of Virology 1999 ; 144: 157-166,
- Takahashi K., Development and differentiation of macrophage. J.Japan lymph reticuloendothelial, Soc. 1997; 37: (3) 173-188,
Table 1
The number of EBER-1 and LMP-1-expressing cells in lymph nodes of HIV-infected individuals
| Histologic subtype9 | EBER-1 | LMP-1 | ||||
| +++ | ++ | + | - | ++ | - | |
| IFH (15 cases) | 0 | 0 | 1 | 14 | 0 | 15 |
| BFD (8 cases) | 0 | 0 | 3 | 5 | 0 | 8 |
| PFD (2 cases) | 0 | 0 | 2 | 0 | 0 | 2 |
| FI (3 cases) | 1 | 2 | 0 | 0 | 3 | 0 |
| Total | 1 | 2 | 6 | 19 | 3 | 25 |
| Normal lymph nodes | 20 | 20 | ||||
|
+++: |
Over 10 positive cells* / 1 high power field |
|
++: |
Over 5 positive cells* / 1 high power field |
|
+: |
Over 1 positive cells* / 1 high power field |
|
-: |
Positive cells are not founded |
|
(*: |
mean value of 10 high power field) |
|
|
|
|
IFH |
(Irregular Follicular Hyperplasia) |
|
BFD |
(Beginning Follicular Destruction ) |
|
PFD |
(Progressive Follicular Destruction) |
|
FI |
(Follicular Involution) |
It, along with the development of HIV infected stage EBER-1 positivity rate, increased and until FI stage, LMP-1 appeared on the cell membrane.
Table 2
Average cell areas and locations in lymph node of EBER-1 bearing cells(Measured by Image Analysis Program with Olympus Avio SP500)
| Location | Average area (μm2) | SD (μm2) |
| Mas, CS | 19.477 | ±5 |
| MZ | 14.246 | ±3 |
| GC | 14.028 | ±4 |
| TN | 11.950 | ±2 |
(average for normal cell: 8-12μm2)
| MAS | = | Marginal Sinus |
| CS | = | Cortical Sinus |
| MZ | = | Mantle zone |
| GC | = | Germinal Center |
| TN | = | T-nodule |
Size of the EBER-1 positive cell varied with their location in the lymph node and it may be a different kind of cell. (For example: B cell, T cell, macrophage, NK cell and so on)
Table 3
Cell type of the EBER-1(+) cells
| Cases | In one visual field (Germinal Center) |
|
| B cells (CD20+) |
56% of THE EBER-1(+) cases (5/9 cases) |
25% of THE EBER-1(+) cells (IFH, BFD) |
| Macrophage (CD68+) |
22% of THE EBER-1(+) cases (2/9 cases) |
10% of THE EBER-1(+) cells (PFD) |
It suggests that many EBV infected cells are B cells.
In addition, EBER-1 positive of macrophage is mid or later stage of HIV infected (for example, PFD).
Table 4
Area of EBER-1/LMP-1 expressing cells in lymph nodes of HIV carriers
| Area/cell ± SD on each case* | |||
| EBER-1(+) LMP-1(+) |
EBER-1(+) LMP-1(-) |
EBER-1(-) LMP-1(-) |
|
| Cases | 3 cases | 6 cases | 19 cases |
| Mean area | 62.83 + 6 μm2 | 29.05 + 7 μm2 | 9.20 + 2 μm2 |
| * 10 cells of each case are measured by Olympus Avio SP500 video analyzer. | |||
It, along with an improved EBER-1 and LMP-1 positivity rate, the infected cell area was increased.
Table 5
Relation of EBER-1 and LMP-1 positive cells
| No.1 | No.2 | No.3 | |
| Stage | PFD | PFD | FI |
| THE EBER-1 | + | ++ | +++ |
| LMP-1 | ± | + | ++ |
It is pointed out that along with the increase of EBER-1 positivity rate and the increase of LMP-1 positivity rate, too, the patient’s condition has worsened in the FI stage.
Figures
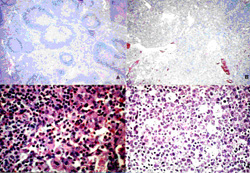
Figure 1
Cell figure of each four phases of LAS morphological classification by Hematoxylin-eosin staining method in 28 cases
| A. IFH stage (x100) | B. BFD stage (x100) |
| C. PFD stage (x400) | D. Fl stage (x400) |
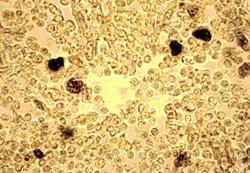
Figure 2
The EBER-1 positive (black) cells expressed in HIV infected lymph node (stage of follicular destruction) by in situhybridization method (x400)
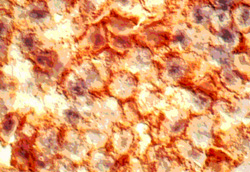
Figure 3
The EBER-1 positive (black) and CD20 positive (red) cells(in stage of Beginning follicular destruction) (x2500)
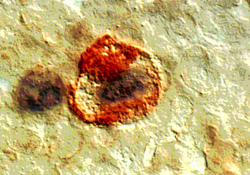
Figure 4
The EBER-1 positive (black) and LMP-1 positive (red) cells(in stage of Follicular involution) by double immunostainingmethod (x2500)
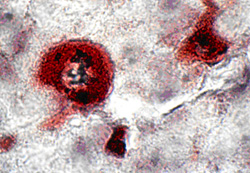
Figure 5
The EBER-1 positive (black) and CD68 positive (dark red)cells (in stage of Progressive follicular destruction) (x2500)